matlab——legend的使用
图例位置设置
Matlab中legend默认的位置在NorthEast,如图所示:
%Matlab中legend的位置设置 默认在右上方

clc
clear
close all
Npoint = 100;
x = linspace(0,4*pi,Npoint);
y1 = sin(x);
y2 = cos(x);
H = plot(x,y1,x,y2);
legend('sin(x)','cos(x)');
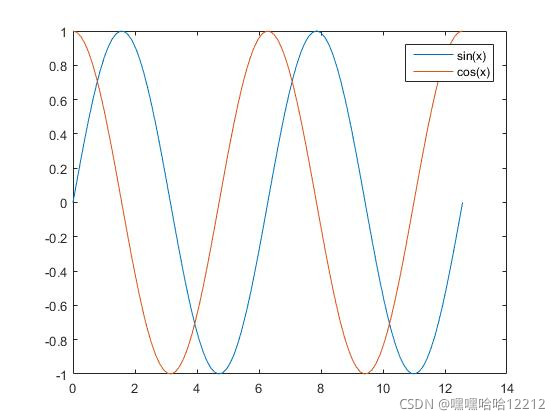
可以通过Location对legend的位置进行改变,变为North,如图所示:
%Matlab中legend的位置设置

clc
clear
close all
Npoint = 100;
x = linspace(0,4*pi,Npoint);
y1 = sin(x);
y2 = cos(x);
H = plot(x,y1,x,y2);
legend('sin(x)','cos(x)','Location','North');
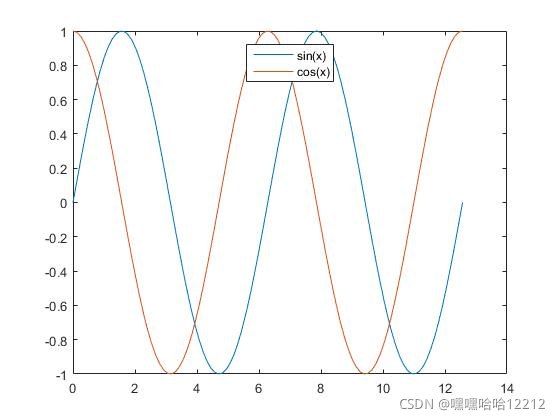
Matlab中有许多位置可以选择:
‘North’ inside plot box near top
‘South’ inside bottom
‘East’ inside right
‘West’ inside left
‘NorthEast’ inside top right (default for 2-D plots)
‘NorthWest’ inside top left
‘SouthEast’ inside bottom right
‘SouthWest’ inside bottom left
‘NorthOutside’ outside plot box near top
‘SouthOutside’ outside bottom
‘EastOutside’ outside right
‘WestOutside’ outside left
‘NorthEastOutside’ outside top right (default for 3-D plots)
‘NorthWestOutside’ outside top left
‘SouthEastOutside’ outside bottom right
‘SouthWestOutside’ outside bottom left
‘Best’ least conflict with data in plot
‘BestOutside’ least unused space outside plot
Matlab中还可以选择某条曲线legend的指定显示:
clc
clear
close all
Npoint = 101;
x = linspace(0,10,Npoint);
y1 = besselj(1,x);
y2 = besselj(2,x);
y3 = besselj(3,x);
y4 = besselj(4,x);
y5 = besselj(5,x);
H = plot(x,y1,x,y2,x,y3,x,y4,x,y5);
legend('First','Second','Third','Fourth','Fifth','Location','NorthEastOutside')
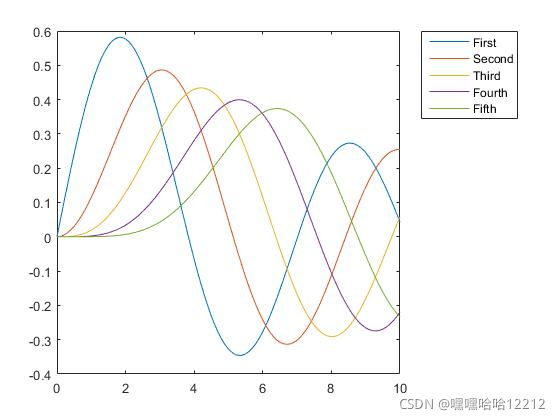
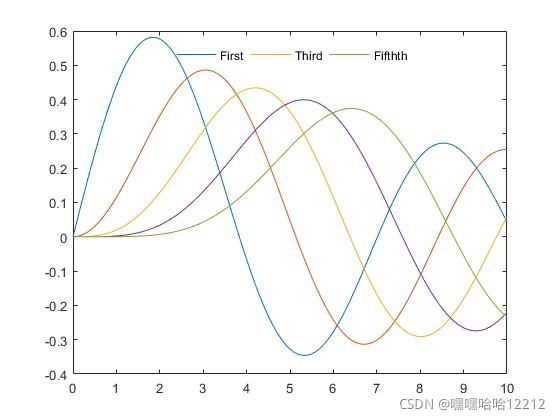
如果只想显示第1、3、5条,也很简单:
%Matlab中legend的选择

clc
clear
close all
Npoint = 101;
x = linspace(0,10,Npoint);
y1 = besselj(1,x);
y2 = besselj(2,x);
y3 = besselj(3,x);
y4 = besselj(4,x);
y5 = besselj(5,x);
H = plot(x,y1,x,y2,x,y3,x,y4,x,y5);
h1 = legend(H([1 3 5]),'First','Third','Fifthth','Location','NorthEastOutside')
%Matlab中legend的横排,注意,Location位置改变为North

clc
clear
close all
Npoint = 101;
x = linspace(0,10,Npoint);
y1 = besselj(1,x);
y2 = besselj(2,x);
y3 = besselj(3,x);
y4 = besselj(4,x);
y5 = besselj(5,x);
H = plot(x,y1,x,y2,x,y3,x,y4,x,y5);
h1 = legend(H([1 3 5]),'First','Third','Fifthth','Location','North');
set(h1,'Orientation','horizon')
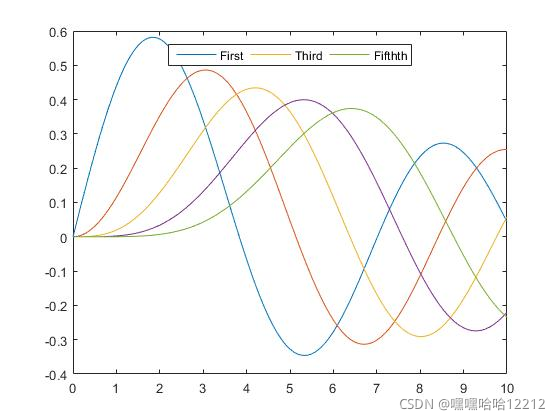
不显示方框的图例
clc
clear
close all
Npoint = 101;
x = linspace(0,10,Npoint);
y1 = besselj(1,x);
y2 = besselj(2,x);
y3 = besselj(3,x);
y4 = besselj(4,x);
y5 = besselj(5,x);
H = plot(x,y1,x,y2,x,y3,x,y4,x,y5);
h1 = legend(H([1 3 5]),'First','Third','Fifthth','Location','North');
set(h1,'Orientation','horizon','Box','off')

「智能机器人开发者大赛」官方平台,致力于为开发者和参赛选手提供赛事技术指导、行业标准解读及团队实战案例解析;聚焦智能机器人开发全栈技术闭环,助力开发者攻克技术瓶颈,促进软硬件集成、场景应用及商业化落地的深度研讨。 加入智能机器人开发者社区iRobot Developer,与全球极客并肩突破技术边界,定义机器人开发的未来范式!
更多推荐


 13
13 0
0- 0


 已为社区贡献1条内容

所有评论(0)